
Manufacturing's Productivity Gap Is Closing — What the Segmented Data Shows
The reshoring conversation has settled into two competing narratives. American factories are running hot and automation is replacing workers. Or the sector is stagnant and demand is the binding constraint. We pulled the primary federal data. The first story doesn’t survive contact with it. The second is half right — and the half that’s right points somewhere most industrial-tech pitch decks don’t.
What the data says
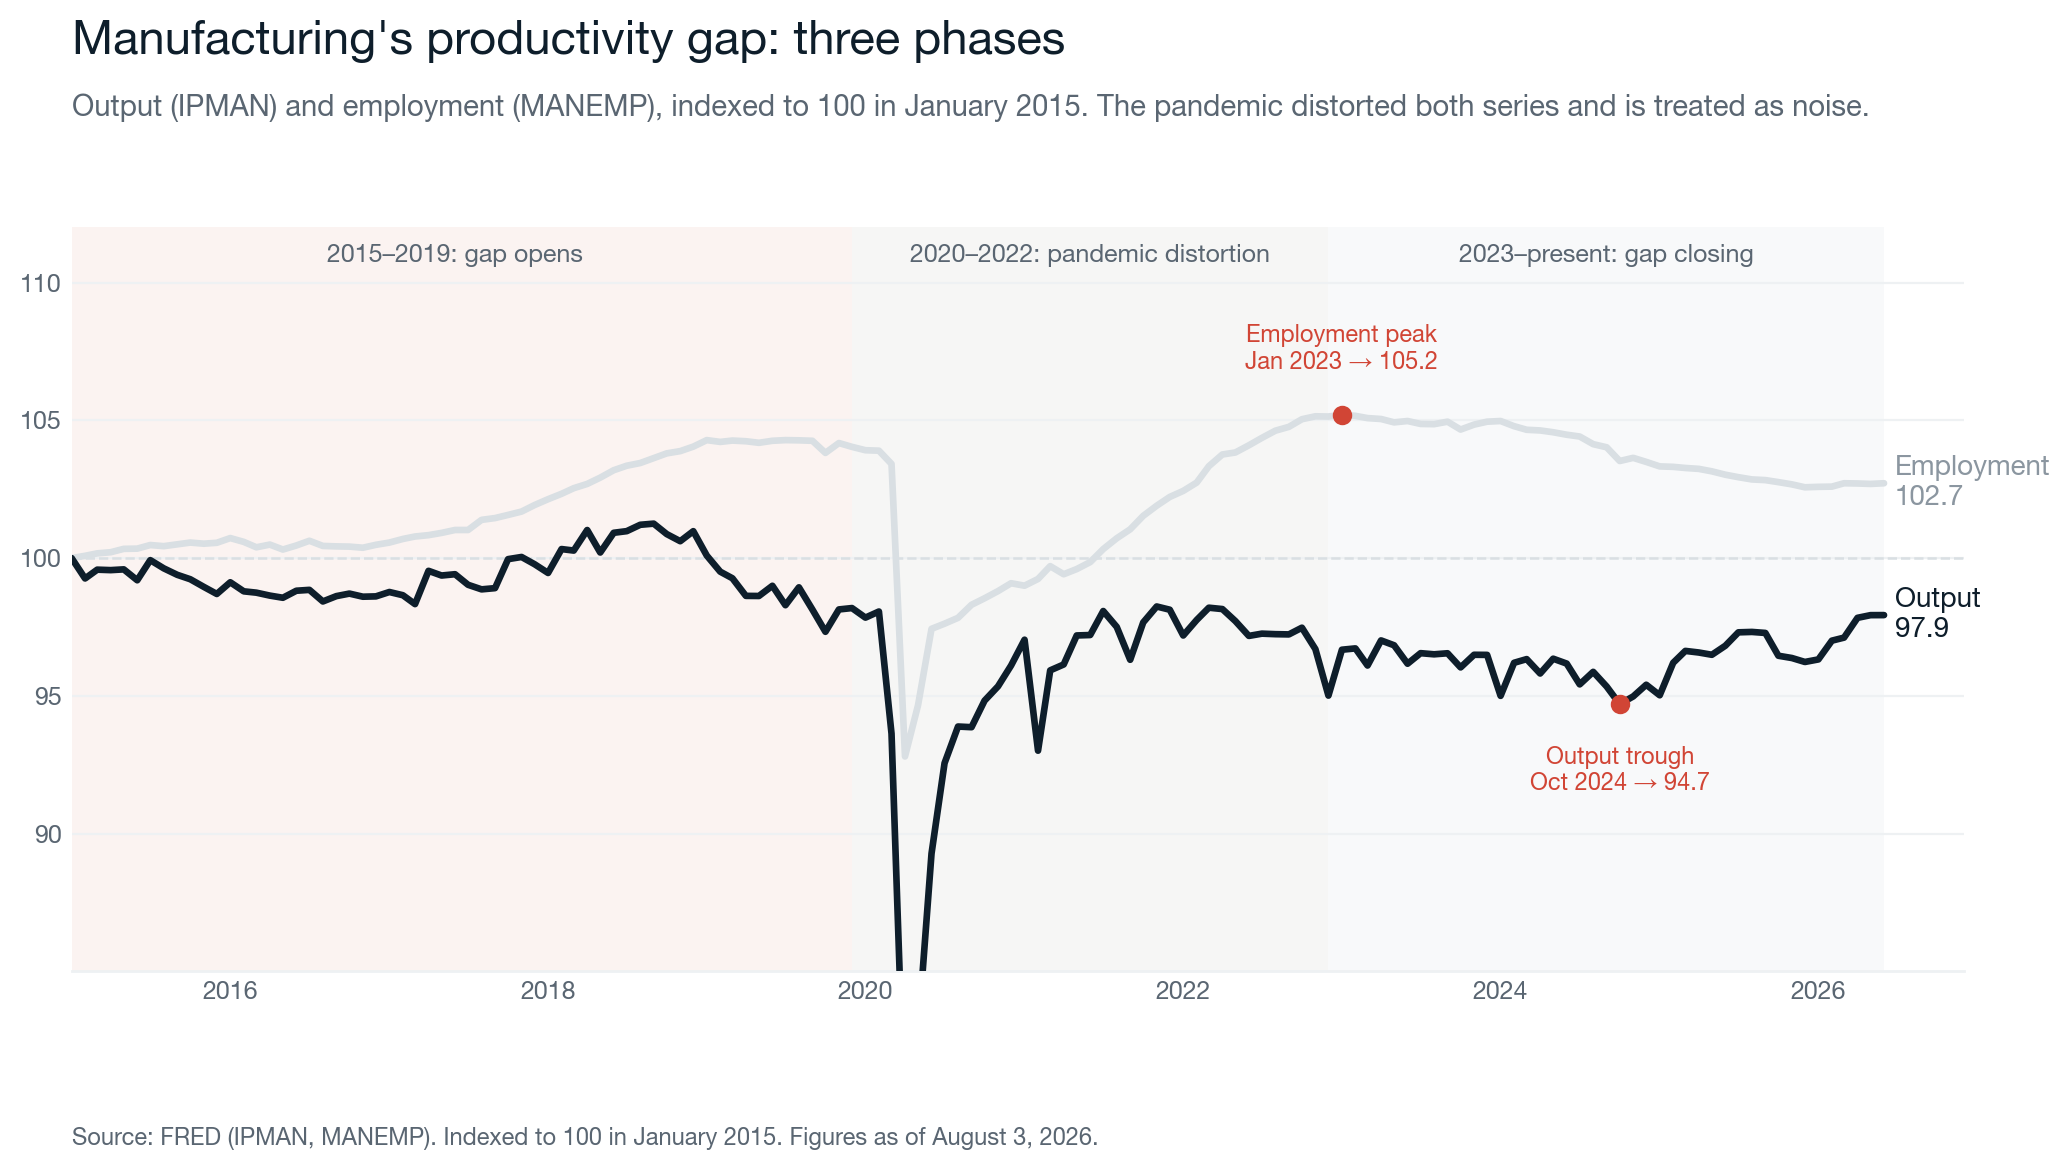
Between January 2015 and June 2026, US manufacturing employment rose from 12.265 million to 12.598 million — a net gain of 333,000 workers, or +2.7%. Output, measured by the Federal Reserve’s Industrial Production: Manufacturing index (IPMAN), sits at 97.9 against a January 2015 baseline of 100 — a net decline of 2.1% over the same span.
Those are the headlines. But the eleven-year span breaks into three phases, and they tell different stories.
2015 to 2019: the gap opens. Manufacturing headcount rose about 495,000 while output slipped 1.8%. BLS’s manufacturing labor-productivity series (Output Per Hour, OPHMFG) fell 3.6% across those five years. This is where the sector earned its “flat productivity” reputation.
2020 to 2022: pandemic distortion. Both series were shocked. We don’t treat this window as signal — hours collapsed and rebuilt across it, and the per-worker and per-hour views diverge for reasons that have little to do with the underlying trend.
2023 to now: the gap is closing. OPHMFG bottomed at 96.3 in Q1 2023 and has climbed to 100.1 in Q1 2026 — a 3.9% gain over three years, +1.5% over the last twelve months. Manufacturing employment peaked at 12.903 million in January 2023 and has since fallen by roughly 305,000 workers. Output bottomed at an indexed value of 94.7 in October 2024 and has climbed 3.4% since — its highest reading in over four years, up 1.1% year over year.
The workforce is smaller than it was two years ago, and output per hour is rising. The 2015–19 productivity gap didn’t disappear. It began to close.
Why segmentation matters more than the average
“Manufacturing” as a single line item hides where the recovery is actually happening. In the June 2026 industrial production release, the Fed’s high-tech equipment market group — computers, communications equipment, and semiconductors — was up 11.1% year over year, running at a 15.5% annualized rate over three months, the fastest of any market group. Business equipment output (IPBUSEQ) was up 5.4% year over year. The broader NAICS 334 computer-and-electronic-products aggregate (IPG334S) — which adds instruments, audio/video, and optical media to the high-tech core — was up 9.2%, growing slower than the fab-and-comms subset. The growth is concentrated in the core, not spread across electronics generally. Consumer goods output (IPCONGD) was down 1.2%. What US factories produce is shifting, and the aggregate index averages it away.
For anyone reading these numbers to build product, the segmentation is where the signal is. A pitch built around “US manufacturing is under-invested in productivity tools” is directionally right and specifically wrong. The segments where headcount is stable and output is growing — high-tech equipment, business equipment — are already investing. The segments where output is contracting have different problems. And high-tech equipment specifically is where reshoring capital has been landing: it is the segment producing the reshoring output already visible in the data.
The utilization problem the automation narrative ignores
Capacity utilization for manufacturing was 75.6% in June 2026, roughly 2.5 percentage points below its long-run 1972–2025 average of 78.1% (both figures computed from MCUMFN unrounded). No plant runs at 100%, and the long-run average already accounts for that. What matters is the 2.5-point shortfall — meaningful slack that dulls the urgency of any throughput pitch.
At that utilization rate, the industrial-tech pitch that sells throughput optimization — “we help you produce more units per hour” — meets a hard buyer objection: nobody pays for more units per hour when hours aren’t the binding constraint. The pain that pulls out a factory manager’s checkbook at 75% utilization is different from the pain at 85%. It is unit cost, margin pressure, and labor scarcity, not throughput.
That reframes what industrial-tech buyers are actually buying. At this utilization rate the pain that gets budget approved looks less like “run the line faster” and more like “run the line with less overtime, less scrap, and less turnover” — cost-per-unit tools, quality automation that reduces rework, predictive maintenance that avoids unplanned downtime, workforce-retention software. That vocabulary matches what the July 2026 Beige Book described in the Twelfth District (San Francisco) summary: “Employers held head counts steady and invested further in AI.”
The objection: reshoring construction is a timing lag
The strongest counter to this reading is that announced reshoring capacity is still being built. Manufacturing construction spending peaked at $250B in September 2024 — more than three times the January 2020 level of $79B — and has fallen 31% since, to $173B in June 2026 (Census release, August 3, 2026). Plants under construction don’t show up in IPMAN until they produce, so today’s output lag could be a timing artifact rather than a productivity problem.
That’s a real objection. The strongest empirical answer is that reshoring output is already visible in the data, just not in the aggregate: the Fed’s high-tech equipment market group is up 11.1% year over year and running at a 15.5% annualized rate over three months — the fastest of any market group, and precisely the segment where the CHIPS-era capital went. The reshoring bump has arrived in the segment that received the investment; the aggregate hides it.
The first tranche of that capacity is producing now; the bulk is still ahead. And whenever the next wave lands — fabs take two to four years, so most of the 2023–24 construction cycle produces in 2026–2028 — it will land on a workforce that is currently shrinking and utilization that is currently loose. The productivity question doesn’t disappear when new plants open; it becomes the question of who ramps them efficiently.
Interplay’s read
The productivity gap that opened in the 2015–2019 hiring boom is closing right now, on a workforce that is shrinking rather than expanding. That is the transition worth understanding. The story visible in the data is not labor replacement. It is labor leverage under scarcity, and cost discipline under loose capacity.
Sources
- Federal Reserve Board — Industrial Production: Manufacturing (IPMAN), seasonally adjusted, monthly through June 2026 — fred.stlouisfed.org/series/IPMAN
- U.S. Bureau of Labor Statistics — All Employees: Manufacturing (MANEMP), seasonally adjusted, monthly through June 2026 — fred.stlouisfed.org/series/MANEMP
- U.S. Bureau of Labor Statistics — Manufacturing Sector: Labor Productivity (Output per Hour) for All Workers (OPHMFG), quarterly through Q1 2026 — fred.stlouisfed.org/series/OPHMFG
- Federal Reserve Board — Industrial Production: Business Equipment (IPBUSEQ), seasonally adjusted, monthly through June 2026 — fred.stlouisfed.org/series/IPBUSEQ
- Federal Reserve Board — Industrial Production: Computer and Electronic Product Manufacturing, NAICS 334 (IPG334S), seasonally adjusted, monthly through June 2026 — fred.stlouisfed.org/series/IPG334S
- Federal Reserve Board — Industrial Production: Consumer Goods (IPCONGD), seasonally adjusted, monthly through June 2026 — fred.stlouisfed.org/series/IPCONGD
- Federal Reserve Board — Capacity Utilization: Manufacturing (MCUMFN), monthly through June 2026 — fred.stlouisfed.org/series/MCUMFN
- Federal Reserve Board — Industrial Production and Capacity Utilization G.17 release, July 17, 2026 — federalreserve.gov/releases/g17/20260717
- U.S. Census Bureau — Total Construction Spending: Manufacturing in the United States (TLMFGCONS), monthly through June 2026 — fred.stlouisfed.org/series/TLMFGCONS
- Federal Reserve Board — Beige Book, July 2026, Twelfth District (San Francisco) summary — federalreserve.gov/monetarypolicy/beigebook202607-summary.htm